
Graphs
Implement
Add the ServerHostingGraphTrait to your Page and Action class:
Page handler
What backups do you want to load? This shortcut traits allows multiple, separate pages of graphs. Therefore, please specify all of your graphs in the page handler.
Your graph pages should have the graphs prefix so the shortcut trait can recognize them. If you module only has multiple separate graph pages, please pass the technical name of the page after graphs-
public function getAvailablePages() {
   return [
       "graphs" => new ProductPageItem(
             "Usage stats",
             "chart-simple"
       ),

       "graphs-power" => new ProductPageItem(
             "Power",
             "plug"
       ),
       "graphs-network" => new ProductPageItem(
             "Network",
             "network-wired"
       ),
   ];
}
The following function in the page handler returns the data of the graph timeseries. The function returns a ServerHostingGraphResponse(), which has...
Array of graphItems
(optional) Array of available time series
The graphItems are an array of ServerHostingGraphItem() which has...
Title of the graph
Array of data series (more about that below)
Array of data labels
(optional) Data suffix
This is an example from Virtualizor, which create multiple graphs:
public function _getGraphs(ProductHosting $productHosting, string $page, Request $request, string $graphName) {
	// Get historical data from Integration, in this case Virtualizor
	$monitorStats = $productHosting->module->getHostingHandler($productHosting->sales_channel_id)->getEnduserClient()->monitor($productHosting->custom_fields['vpsId']);

	$labels = []; // <-- Array for labels
	$ramSeries = []; // <-- Array for each graph to temp store data
	$cpuSeries = [];
	$diskSeries = [];
	$networkSeries = [];

	// Iterate all the data from virtualizor
	foreach ($monitorStats['monthly_data'] as $item) {
		$labels[] = Carbon::parse((int)$item[1]); // <-- Add the date to the labels

		// Then add each data to the series
		$ramSeries[] = (float)$item[5];
		$cpuSeries[] = (float)$item[6];
		$diskSeries[] = (float)$item[3];
		$networkSeries['in'][] = (float)$item[7];
		$networkSeries['out'][] = (float)$item[8];
	}


	// Create a GraphItem for each graph and pass the series, labels and suffix
	return new ServerHostingGraphResponse(
		[
			new ServerHostingGraphItem(
				"RAM usage",
				$ramSeries,
				$labels,
				"GB RAM",
			),
			new ServerHostingGraphItem(
				"CPU usage",
				$cpuSeries,
				$labels,
				"%",
			),
			new ServerHostingGraphItem(
				"Disk usage",
				$diskSeries,
				$labels,
				"MB",
			),
			new ServerHostingGraphItem(
				"Network usage",
				$networkSeries,
				$labels,
				"B/s"
			),
		],

		// This are the available series, if any
		[
			"MONTH" => "Monat",
			"WEEK" => "Woche",
			"DAY" => "Tag",
		]
	);
}
What are series?
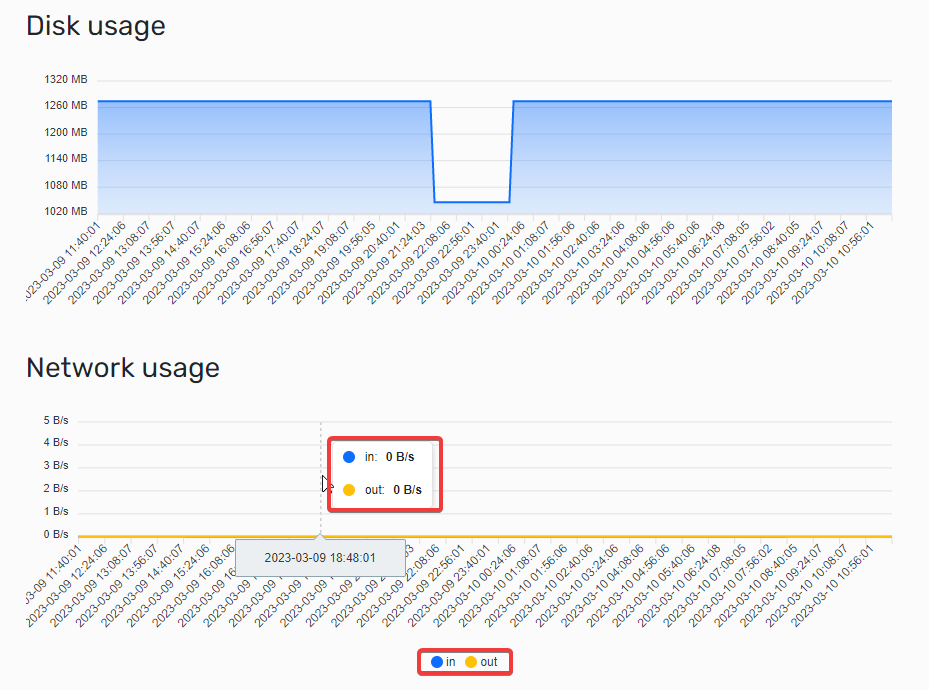
So called series is the actual data which should be displayed in the graph. A graph can either have one or multiple series, depending on how many layers the graph should have.
The graph at the top only has one series, at the bottom has two series. Take a look:
If you have one series, the series property of the GraphItem can be a one dimensional array. If you have multiple series, create a multi dimensional graph. The key of the multi-array will be displayed as series label.
Optimizing series
Dont worry about calculating the average of the series to optimize the amount. Hostware already does that for you! Some integrations would return thousands of data points, which would be too much to display in the browser. Hostware automatically iterates each data point and calculates the average to shrink the overall size to about 200 data points per graph. No need to worry, just return all data points the integration has to offer!